
TrackSide Pi
A low cost alternative to expensive OEM data logger for automotive enthusiasts
A low cost alternative to expensive OEM data logger for automotive enthusiasts
As an alternative to expensive OEM data logger solutions, the team constructed a Raspberry Pi based embedded system that will log and display data from vehicle and external sensors. Key functions include communicating with the vehicle’s OBD-II (on-board diagnostics) port via a bluetooth transceiver, wired communication with external accelerometer, GPS and a camera. The Pi will log and record the data and display relevant numbers onto the PiTFT with a web interface developed to view previously recorded data and video
For many automotive enthusiasts, taking your personal car to a weekend autocross or high-performance driving event is a popular pastime. Having vehicle system data, as well as lap times, are essential to understanding driver performance, and maximizing the vehicle. Most 1990s and newer passenger cars are equipped with tens to hundreds of sensors reading engine, suspension, and external parameters. Logging this data can be accomplished several ways. Corvette features an integrated solution on its Corvette that includes dash-camera footage as well as engine telemetry, speed, etc. The data is logged onto an SD-card for the driver to extract and read later.
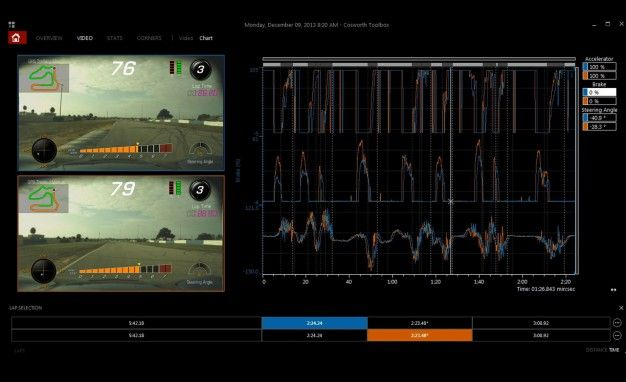
For the 2020 C8 Corvette, the Performance Data recorder option adds $1,795 to the price of a new ‘Vette. Porsche, as an alternative, offers a free app that connects to the vehicle via bluetooth and acts as an onboard camera and simultaneous data loggeloggerr. Several non-OEM solutions exist including the popular Vbox gps data logger by Racelogic and vehicle data logger by Motec which costs $3,228 from a retailer.
As an alternative to expensive OEM data logger solutions, the team designed and developed a Raspberry Pi based embedded system, Trackside Pi, that will log and display data from vehicle and external sensors as well as camara. The Trackside Pi communicates with the vehicle’s OBD-II (on-board diagnostics) port via a bluetooth transceiver to collect vehicle metrics, and uses wired connections to communicate extra sensors including a GPS, an accelerometer and a camera. The Trackside Pi logs and displays metrics collected from connected devices on the PiTFT, as well as a live dash-cam view with footage saved to the SD card. Touch screens and buttons are utilized to config and control the Trackside Pi behaviors and functionalities. In addition, the Trackside Pi also includes a running web server that provides ability for users to view well plotted and organized logged data through a computer or phone.
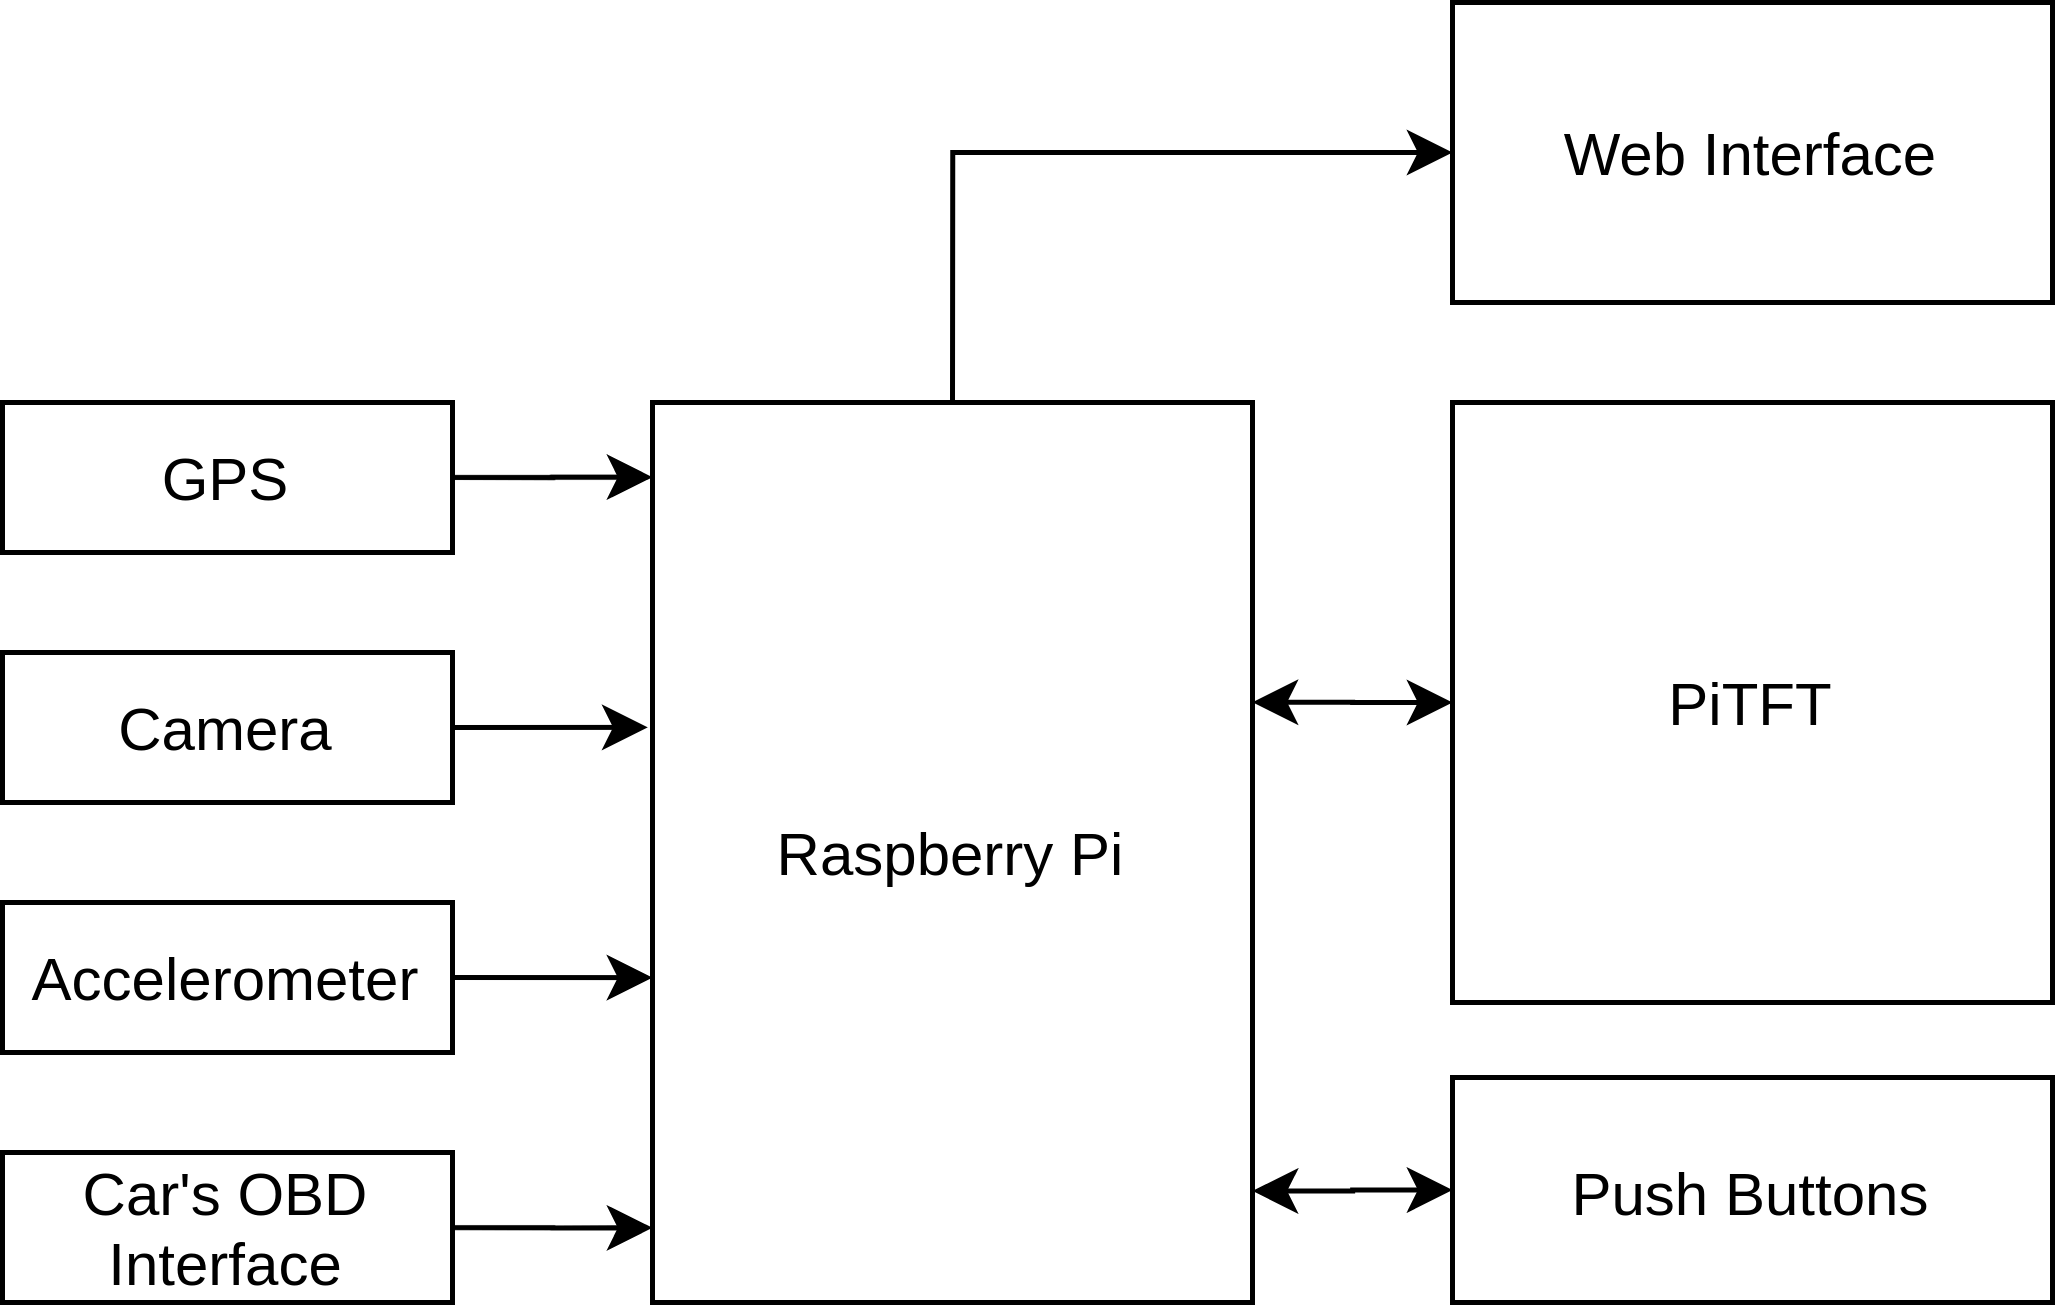
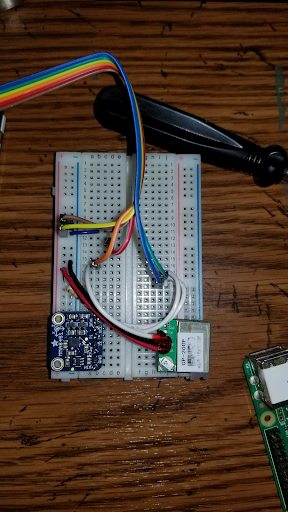
The overall system design is shown as the figure above. GPS, camera, accelerometer and the car’s OBD interface is connected with Raspberry Pi for driving data collections. PiTDT with push buttons provides an on-device user interface to control the Trackside Pi’s behaviour. The web interface is provided as a user interface to view historical data logged by Trackside Pi.
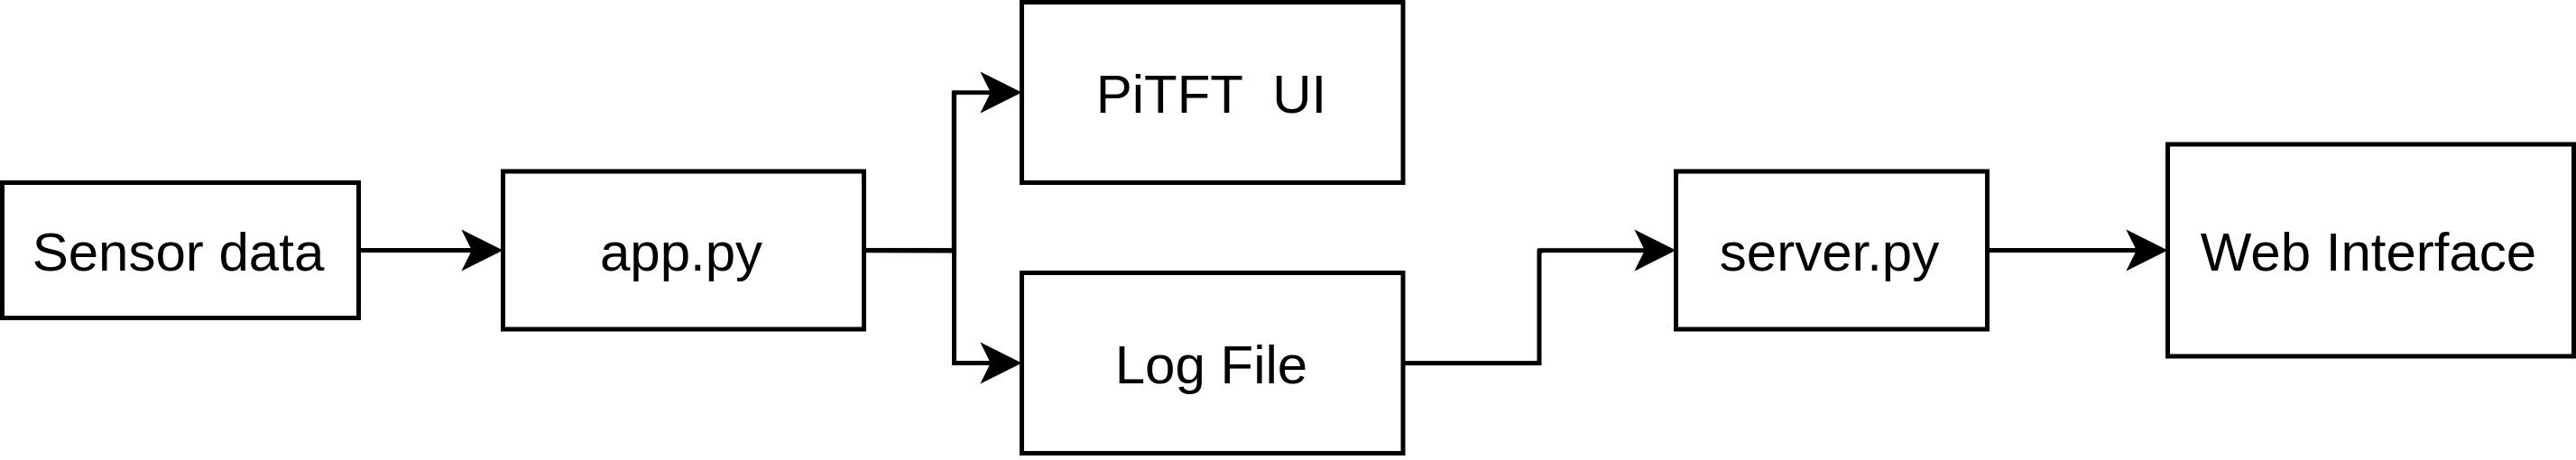
The software of Trackside Pi consists of two parts, an app.py that is responsible for reading sensors and handling PiTFT UI, and a server.py that uses Flask to host a web interface. As shown in the figure above, app.py reads sensor data and updates them into PiTFT UI as well as logs them into log files. The server.py is a simple Flask server that monitors the log files and serves these data with a simple web Interface.
The Adafruit MMA8451 triple axis accelerometer used in this setup communicated with the Raspberry Pi over I2C protocol. On the hardware side, the sensor is supplied power, tied to the SCL and SDA pins, and the address pin is pulled high. The address of the sensor on the I2C bus is consequently set to the default value. Implementing the sensor in software is largely laid out in the datasheet.First off, enter the Raspberry Pi configuration menu and enable the I2C bus, then restart. Then, Adafruit’s Circuit Python library needs to be downloaded and installed. The “blinka” library provided by adafruit interprets the simplified commands native to the device into a Linux hardware API, such as GPIO. With circuit python installed, the following command needs to be issued to install the package specific to the MMA8451 accelerometer.
sudo pip3 install adafruit-circuitpython-mma8451
This sensor specific package makes instantiating the sensor, changing its settings, and reading trivially simple. Following the example code provided in the data did not, however produce success initially. A short, 1 second delay was added immediately after declaring a new I2C device to allow time for the accelerometer to begin transmitted data correctly. Without this delay, the Raspberry Pi failed to read the device. In the Trackside Pi, the sensor logs data at 400Hz and is fixed to the case. Its readings were converted from m/s^2 to g’s and its readings were interpreted to fit the standard automotive coordinate system: X forward and Z downward.Once initiated, the sensor responded reliably and instantly to queries.
The sparkfun GPS-13740 (manufacturer PN: GP-20U7) unit used to communicate directly with the Raspberry Pi over the GPIO serial port. Hardware setup only requires powering the sensor with 3.3V and connecting its TX pin to the Pi’s RXD pin. The GPS datasheet provides the attributes of the serial communication, including the baud rate. In attempting to simply read the raw output of the unit, one immediately comes across several issues. Initially, one must enter the raspi-config and disable serial interfacing. This prevents the OS from using the serial0 port for communicating with the console. With the internal serial port freed up, the sensor should be readable on the /dev/ttyS0 port, not /dev/ttyAMA0. Note that the sensor takes anywhere from a few seconds to a few minutes to acquire a position, depending on signal strength. In an outdoor environment, the sensor should acquire lock in a few seconds and begin transmitting 8bit messages following the NMEA-0183 protocol. To parse and interpret this information, an open source library named “pynmea2” was used. After downloading the package (cited in references), the package is imported into a python program and functions can be called to directly read latitude, longitude, speed, and many other parameters. For our application, latitude and longitude were read at their natural logging rate of about 2Hz. The position data was displayed on the screen and logged in a mapping application.
Communicating with the OBDII transceiver module over bluetooth proved challenging in a variety of ways. The hardware involved only incldues the Veepak OBDII scanner. This module is typical and many other manufacturers sell units that also use the elm327 chipset in a similar package. The veepak unit is not recommended, due to software issues. After enabling bluetooth in the the raspi-config menu, the one must download and install the bluez package (included in the python reference page) to ensure the OS has the correct bluetooth stack. Running the following command will then install the open source python-obd package.
sudo pip3 install obd
With the obd tools installed, a serial-over-bluetooth connection needs to be established on the Pi. First, enter the bluetoothctl environment, and scan for the obdII bluetooth device. Ensure the module is plugged in and the car ignition is on prior to doing so. With the device trusted and paired, run a command to disconnect the device. This ensures that the device is available for serial communication. Exit the bluetooth menu and use the rfcomm utility to bind the MAC address of the OBDII adapter to the /dev/rfcomm0 port. This establishes an avenue for serial communications over a bluetooth connection. Following the example code provided in the python-obd site, our first try to connect and receive data from the module was successful, but running the same program routinely produced an error. Enabling the debug feature displayed the error to console, it stated that the program successfully connected to the elm327 module but failed to connect to the car’s engine control unit (ECU). Further inspection of the console output displayed that the Pi was issuing commands, waiting for responses for a short period, then issuing new commands before the original query was responded to. The late responses produced a data mismatch and crashed the program. To remedy this issue, we edited the source code of the python-obd package directly to force a 50 millisecond delay after every command issued to the adapter. Doing so involved editing the .__send() function in the elm327.py script of the package. After making this fix, the initialization program for the adapter had adequate time to receive initialization responses from the ECU and begins transmitting data correctly.
Synchronous vs Asynchronous control: The python-obd package includes classes for synchronous and asynchronous communication objects. The former establishes a connection where the reading program, in this case the RPi, will wait for responses to queries before moving to its next command. This ensures that data is logged in real time though can negatively affect refresh rate and is prone to errors. Since each query to the ECU is blocking, an inconsistency in the Pi’s scheduling can result in missing responses and crashing the program. Alternatively, an asynchronous connection “watches” specified channels continuously and will return the most recent reading. Our project utilizes asynchronous control to allow the user interface to refresh faster than then roughly 2Hz logging rate of the OBD unit.
Notes about the Veepak Bluetooth Unit: The connections issues that led to changing the python-obd source code were likely caused by faulty firmware in the cheap OBDII reader used. This forum discussion referred to us by another project group highlighted that some chips version 1.5 of the elm327 firmware, which is a known counterfeit. Current elm327 chips are on version 2.2 and are noted to not have the same connection issues.
The User interface is built with pygame and consists of 2 views, the camera view and data view. The camera view renders a live stream of what the camera sees. The data view displays live sensor data that is being collected by Trackside Pi. The data view displays data in 3 status, offline, unlogged, logged. The offline data are shown in gray, indicating that the device is not currently connected. The unlogged status and logged status are shown in white and green, indicating whether the data will be saved when recording starts. The logged and unlogged status can be toggled by touching the corresponding data on the screen.
Three push buttons are used to control the Trackside Pi user interface. The first two are used to switch between the camera view and the data view. The third button is used to toggle recording status.
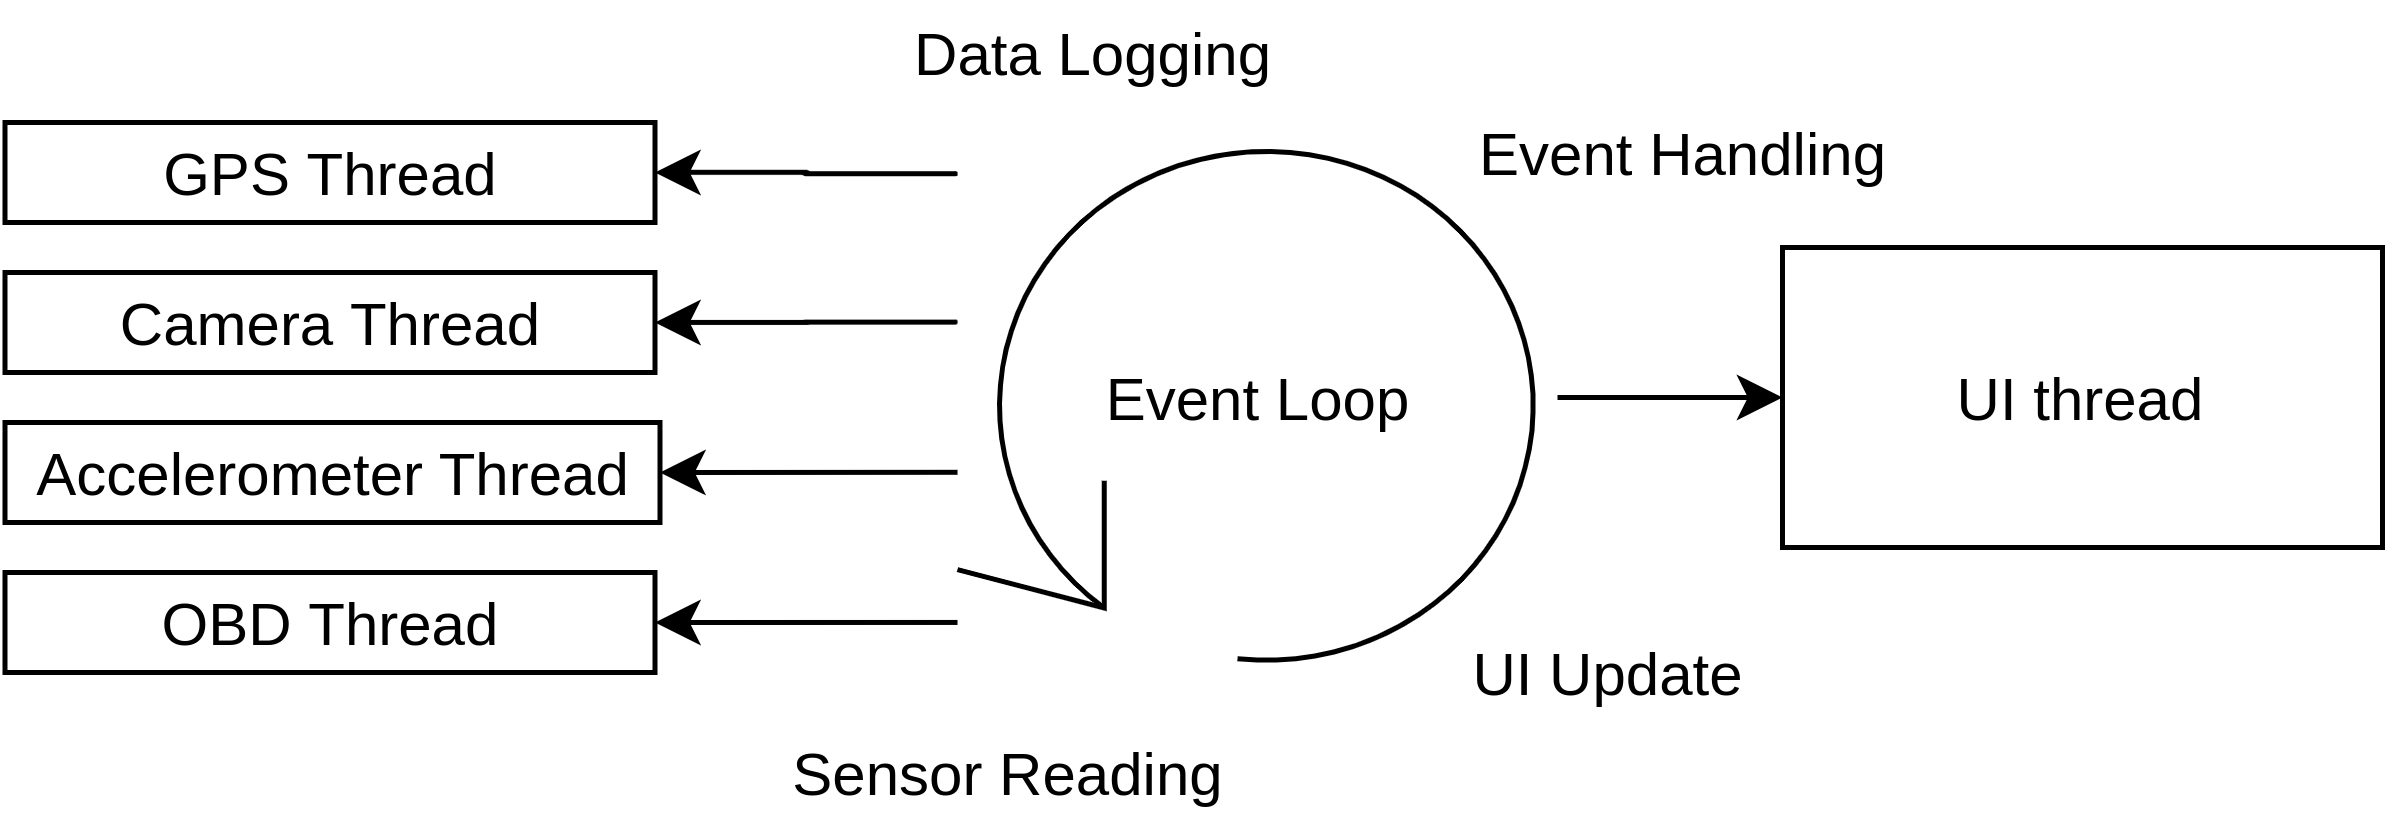
The UI is implemented in app.py and integrated with sensor communications. App.py creates threads for sensor reading and PiTFT UI. It stays in an event loop where it constantly checks for sensor reading threads to see if there’s any change in sensor reading data, then it updates the UI threads with newly collected data and checks if there’s any event happening on the PiTFT touch screen and push buttons. Finally it logs current reading if it is in the recording mode.
In the sensor reading phase, sensor communication routines have been integrated into the UI routines. The implementation of sensor communication integrate has gone through 3 iterations. In the first iteration, the integration is done by sequential calls to each sensor communication routine in the event loop. Such implementation successfully collects and updates sensor data to the user interface. However, some sensor communication took a long time. Since the sequential calls are blocking, the UI becomes unresponsive when time-consuming sensor communication happens. Then we switched to the second implementation where we put sensor communication into a seperate file and use named pipes to exchange sensor data between app.py and the new separate file. With this implementation, app.py and the sensor communication routine execute in separate processes so the time-consuming sensor communication does not block the UI. However, reading and writing the name pipe itself is a relatively time-consuming task. The UI is still responding slowly even after the improvement. Finally we switch to our third implementation where we use python threading libraries to execute each sensor communication using separate thread and global shared variables between these threads are used to exchange data information. With this implementation, all sensor communications are non-blocking and the data exchange happens in memory without going through named pipes. We finally achieved responsive UI with the third implementation. Beyonds, putting each sensor communication into separate thread also gives us control on the rate of sensor reading individually. Accelerometer communication is fast so we add 0.5s delay in the loop in its thread. GPS reading is very slow so we try to read as fast as we can in its thread. Thus, we maximized the utilities of the peripheral bus by using a proper reading rate for each sensor.
In the UI updating phase, app.py first checks a new_data flag for each sensor data to see if the sensor reading has been updated in the sensor reading phase and only updates the screen if any data is updated.
In the event handling phase, app.py first checks if any part of the touch screen is touched, and toggles the data log status on the touched area. Then it checks if any buttons are pressed, if the first button is pressed, it sets the view flag to be cam_view, if the second one is pressed, it sets the view flag to be data_view. All the status/view changes will be updated at the next iteration in the UI updating phase. If the third button is pressed, the app.py sets the recording flag to be true so that in the following iterations all marked data will be saved. After that, it prepares the file system for data rerording by creating necessary folders and files to store the logged data. Then it returns to the event loop to continue execution.
In the data logging phrase. The recording flag is checked. If it is in recording status, a timestamp will be created and all data that marked will be logged with the timestamp. Camera views are saves as raw images and will be converted into MP4 using ffmpeg at the end of recording.
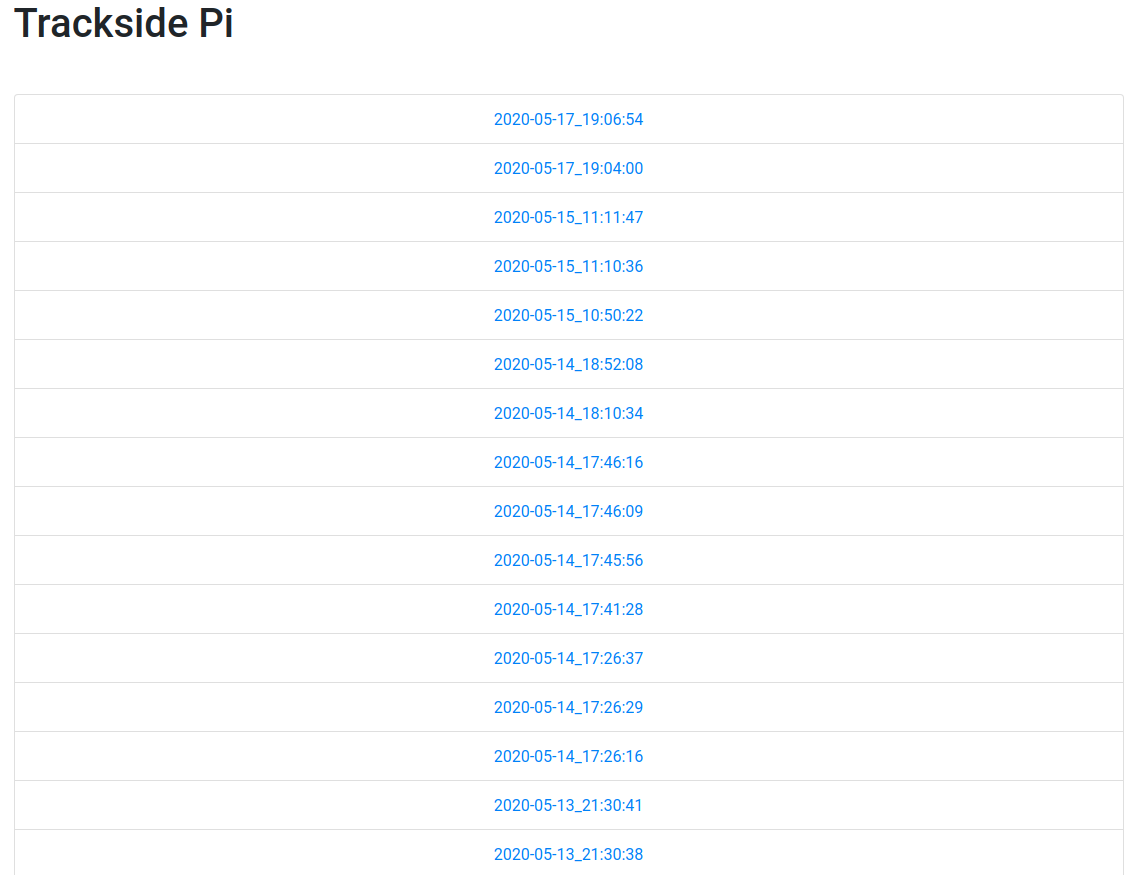
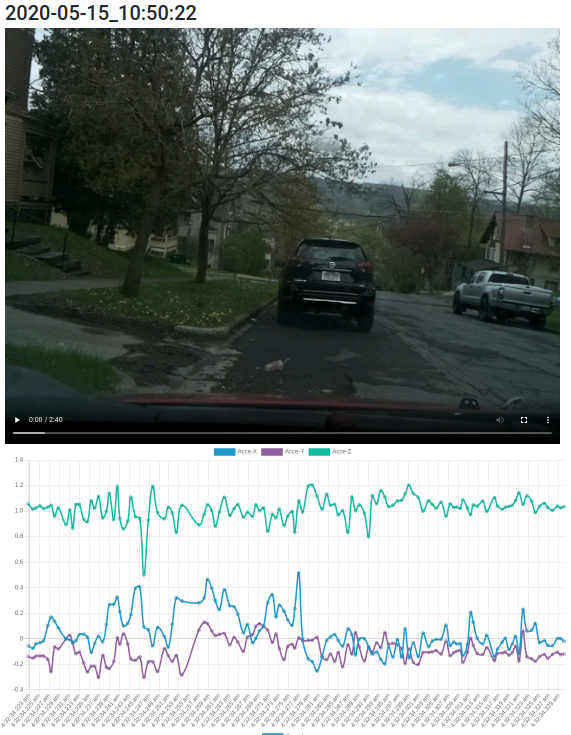
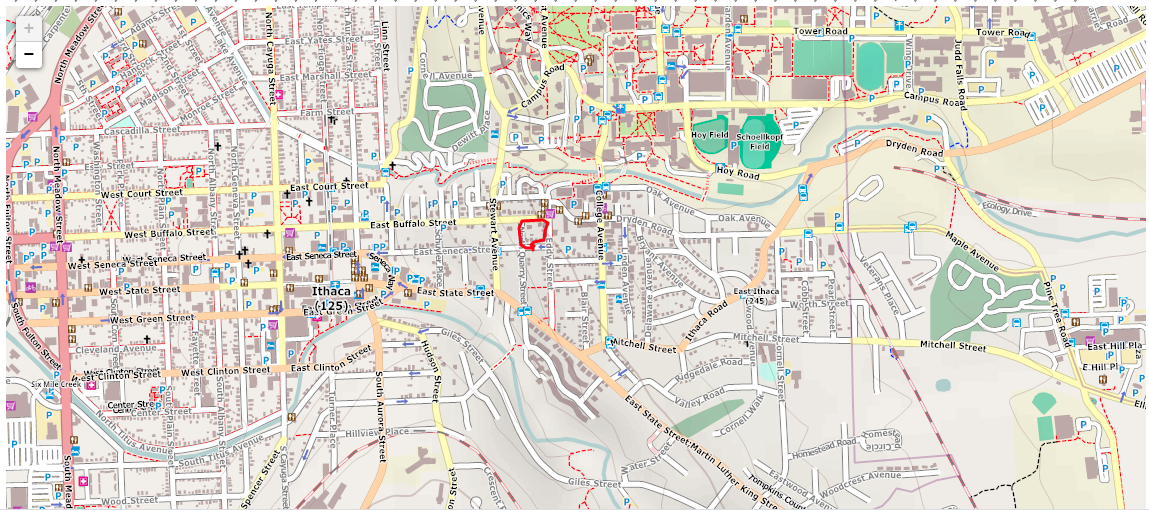
The web interface is built with the python-flask package. It monitors and serves the content saved by app.py. 2 pages are served. The homepage lists all the saved recordings and a detailed page shows all recorded data for each reach recording. Saved video is directly displayed as a video file, GPS data is preprocessed to draw the car’s path on a map. All other data is displayed by rendering into line charts.
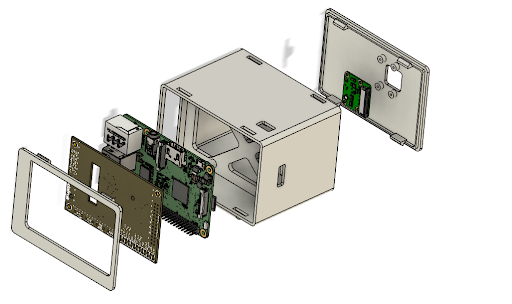
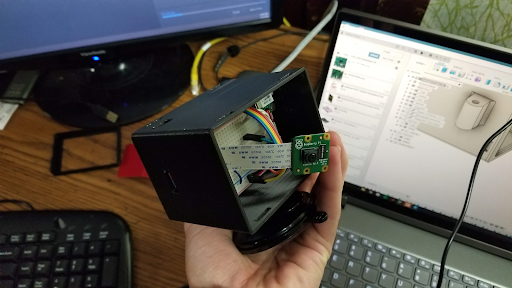
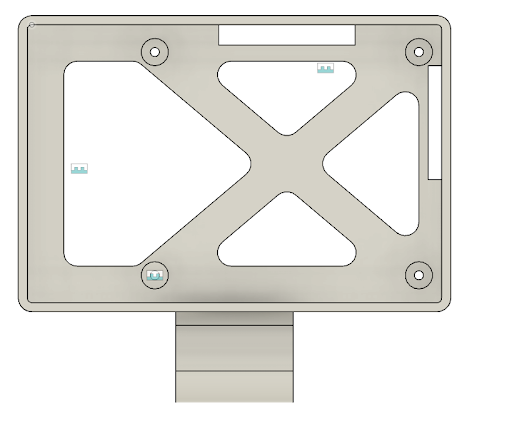
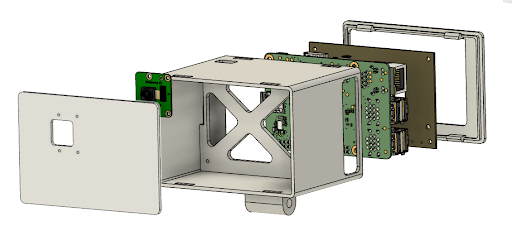
The case was designed in Autodesk Fusion 360 with additive manufacturing in mind. The unit is effectively a rectangular case with a separating wall near the center. The frontal compartment features 4 small bosses to mount the Raspberry Pi with screws. The camera ribbon cable and GPIO cables pass through openings in the separating wall to the rear compartment. Note that a few jumper cables were used in place of the Pi Cobbler 40 pin GPIO breakout cable. The extremely wide breakout cable passed over the top of the Pi and obscured the usb power port! Jumper cables were substituted and simply plugged into the necessary pins on the underside of the PiTFT. The rear compartment of the case houses a compact breadboard with the GPS unit and accelerometer plugged in. This small board is simply fixed to the separating wall with double-sided tape. The rear lid of the enclosure features 4 mounting holes for the PiCamera module and snaps in place to the larger module. All parts were printed in black PLA on a Printrbot simple metal owned by one of the team members.
Design of the enclosure assembly benefited greatly from accurate models of the Raspberry Pi and camera module all found on GrabCad. A cad file of the PiTFT was not available, rather a PCB file in Autodesk Eagle. Using Fusion’s PCB tool, the Eagle file can be imported and exported as a 3D file. Links to their sources along with cad models of the enclosure are included in the reference section.
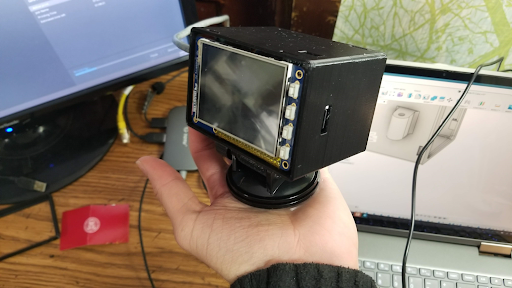
Assembly of the unit is straightforward. With the touch screen not yet connected, place the Pi in the front of the enclosure and screw it in at its 4 mounting locations. Plug in the camera module ribbon cable and pass it through the opening in the side of the inner wall to the rear. Next, plug the jumper cables into their appropriate locations on the PiTFT and pass their other ends through the opening at the top of the wall. Then plug in the TFT. On the rear side, plug the expansion cables into the protoboard and screw the camera module into the rear lid with the M2 screws. Finally, plug in the camera module and snap the rear lip into the case body. Note that the front cap was not included in this demonstration to make removing the Pi for debugging simpler.
The suction cup mount requires modification to be used with the enclosure. With the mount in the as-purchased condition, unscrew the thumbscrew all the way and remove the bolt. Remove the phone mounting arm and replace it with the enclosure's mounting tab. Simply reinsert the bolt and use the same thumb screw to tighten and adjust the angle of the assembly. For our demonstration, the Trackside Pi was secured to the dash with the suction, and held well though bumps and turns.
The Trackside Pi is a fully self contained data logging and video recording device with vast versatility. The complete system only involves a commonly available OBDII bluetooth module, the suction-cup mounted Trackside Pi, and power from a car charging port. As laid out in the concept of the system, the Trackside Pi is intended to bring data logging and recording capabilities to older vehicles that lack such systems at a low cost. The system should be compatible with any car post 1996 (when OBDII was adopted) because the software automatically acquires the protocol of the vehicle. The current configuration only queries a few essential engine sensors and includes other sensors external to the vehicle to give the user what we consider to be an essential overview of the vehicle’s performance. High refresh rate logging of the vehicle’s acceleration quantifies the car’s braking, cornering, and acceleration capabilities. GPS recording is a less essential but unique application that allows a user to review a very accurate trace of the vehicle’s position on a map. These capabilities, coupled with engine parameter logging over OBD ultimately supplant video recording of the captured driving sessions. At a track-day, the Trackside Pi allows for any driver to race a session then pull in, plug in a laptop and watch back the recording with time-synchronized data. All with a compact system costing a fraction of an off-the-shelf alternative.
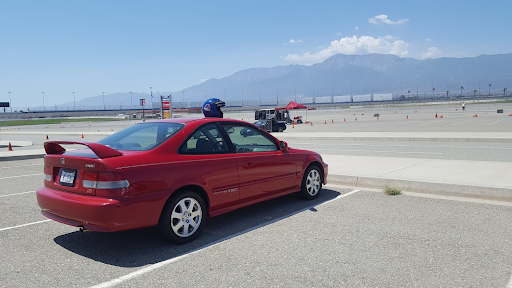
The system in its current state is not without limitations. In the process of developing the Trackside Pi, for example, we met hardware limitations in attaching an audio recording device. At first, we intended to use the Pi’s 3.5mm jack for a microphone but noticed it is output-only. After purchasing a 3.5mm to USB adapter, the pi mistakenly recognized it as a playback device. Time restrictions prevented us from ordering a usb-microphone or integrating it in software. Also we expected nearly instantaneous communication with the vehicle for data logging. We ultimately achieved about 1-2Hz. Intentionally delaying responses limited the rate to 20Hz at best. Bluetooth communication itself involves latency and also slows the process. However, the slowest element in the communication chain is likely the 1999 engine control unit of the Honda Civic Si used for testing. OBDII was established for recording data for emissions testing, not on-track performance. OBD is also thereby limited to sensor channels that are necessary for emissions testing. A channel such as steering angle may be monitored in the ECU but is not available over OBD. Other limitations included the processing capabilities of the Raspberry Pi involving data capture and recording. To maintain a decent UI responsiveness, video was captured at 13 frames per second. More processing speed would allow for smoother, and high quality video recordings.
With more time to develop the project, there are several areas we would explore:
| Description | Link | Qty | Price |
|---|---|---|---|
| Raspberry Pi Model 3 B | 1 | Not included in total | |
| Raspberry Pi Camera Module 2.1 | 1 | Not included in total | |
| Bluetooth OBD II Scanner | Amazon | 1 | $11.99 |
| Sparkfun GPS GP-20U7 | Mouser | 1 | $19.04 |
| Adafruit Triple-Axis Accelerometer MMA8451 | Mouser | 1 | $7.95 |
| Suction Cup Phone Holder | Amazon | 1 | $9.48 |
| Bluetooth FM Transmitter and Car Charger | Amazon | 1 | $17.95 |
| Micro USB Cable | Amazon | 1 | $5.26 |
| M2 X 6mm Screws | McMaster Carr | 1 (pack of 100) | $12.05 |
| Total | $83.72 |

wsn8@cornell.edu

663yan@gmail.com